Markets are said to “climb a wall of worry”, which is just what they did in the past three months as investors continued to buy stocks
despite the coming “Fiscal Cliff” and lessons of history that labeled September as the cruelest month for equities.
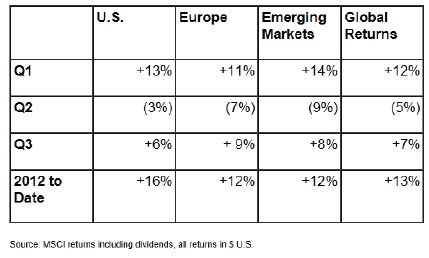
In our conversations with clients over the past few months, it seems we hear a lot of sentences begin with a phrase something like “in this economy”. The context is that a piece of good news or a positive result is somehow unexpected or doesn’t really fit with the current meme of a global financial crisis. Quite unexpectedly, it seems, 2012 is shaping up to be a pretty decent year for stocks around the world, as per the table below:

To help our clients stay up-to-date and see their portfolio in the context of a longer period of time, we’ve invested in our user-friendly
Portal system. What we call our Portals are really just personal websites we have set up for each client with both high level and very detailed reporting on your investments with us. They are very secure. All the information is updated nightly, so the information is timely, relevant, accurate and personal.
 Sometimes, if you can’t beat popular culture, it is best to exploit it. So here we go. Like the world’s most interesting beer pitchman on the left, we don’t expect you to check on your investments every day. But when you do, we want you to have context. The two really important concepts in investing are: “How are your investments performing”, and “How are you performing?” The performance of an investor is whether or not he or she is either saving enough to fund future goals, or withdrawing an amount that is sustainable over time given the investment returns they are earning.
Did you know your portal addresses these questions on demand, any day you ask? For the question of ‘how are you performing?”, we have a new report called Capital Flows, that shows the amounts withdrawn or deposited each year, in both dollars and percentages. Wondering how your investments have done, as a whole, over the past twelve months or since you started? It’s all on your portal, ready for you to see any time you log on, 24-7. Under Reports, click on Account Performance.
Year to date tax information, expenses, detailed information on any investment is all there. If you’d like a refresher course on this
amazing tool, please be in touch. We’ve found it to be a wonderful way to reconnect and help you to deepen your understanding of what we are doing together to relieve financial anxiety and promote fiscal joy.

