
In a backdrop of all kinds of unusual and unexpected news, not the least of which was the largely unanticipated Trump presidential victory, the US Stock market had one of its few “normal” year in over nine decades. Allow us to explain. The US Stock market as measured by broad measures such as the S&P 500 has returned 10% per year, on average, over long periods of time. The actual number since 1926 is 10.04%1. The S&P 500 returned 11.96% last year. Average returns are not what normally occurs, at least over a simple calendar year. Even within a range of plus or minus 2% of the 10% average (anything between 8-12% which includes 2016) only six years in the last 91 calendar years since just before the Great Depression fell within that “average range”.
Most conversations we’re having these days with clients seem to include two topics:
- What does a Trump presidency mean for the economy and the stock market?
- Are rising rates going to make bonds risky?
As we have written before, the president or the political party in office has had less to do with the strength of the economy than is expected or reported. The stock market rally since the election may reflect the anticipation that lower corporate tax rates and lessened regulatory controls are expected to be positive for stock prices and bond repayments. More manufacturing companies shamed into retaining jobs in the US should be positive for US economic growth. So far, at least, unconstrained tweets have not had an adverse market effect. Unpredictable behavior during a Trump administration may be cause for short term volatility. We are reminding clients that the long-term value of the global stocks and bonds we own are primarily tied to the long-term prospects of the underlying companies and governments, less to the political leaders in the nations’ capitals at any given time.
Bond prices, on the other hand, have a mathematical relationship with interest rates and this is worth exploring. Bond prices fall as interest rates rise. The longer the maturity of the bonds, the worse the decline in price. The simplest way to see this in action is to compare US Treasuries of different maturities in the box to the right. At the extreme, a 1% rise in interest rates would cause a 30 Year Treasury bond to lose almost 18% of its value. Because we use bonds as the “anchor to windward” in our accounts, we keep maturities short and qualities high.
Interest rates may have seen their recent lows and could be on the rise. Then again, they might not. We see no reason to take on the risk of predictions. High quality shorter term bonds will continue to provide us with funds when we need them to take advantage of the higher returns available in the stock markets of the world.
We certainly don’t own bonds or CDs today for either their current yield or their ability to keep up with inflation. It has been eight years since the interest on a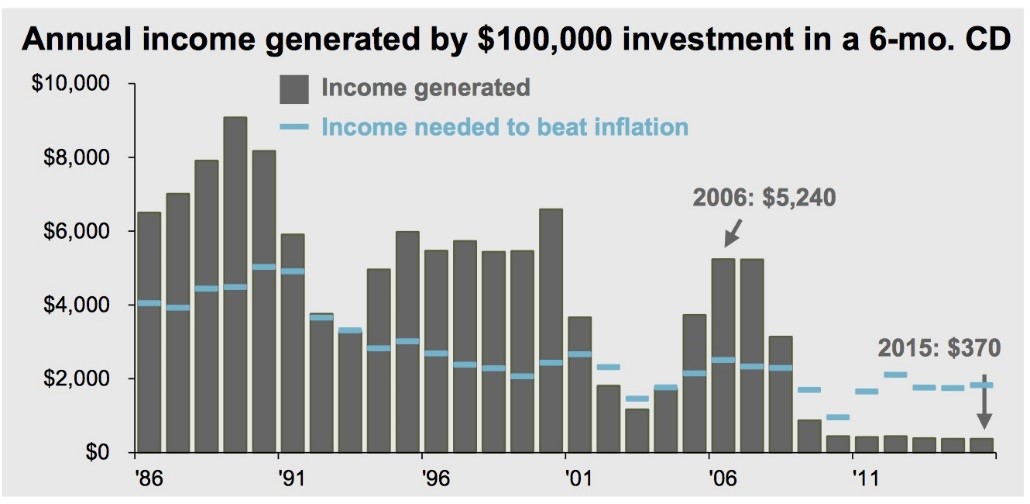 6-month CD exceeded the rate of inflation2, even without considering the erosion of taxes. Hence the adage that long term CD owners “go broke slowly”. The chart to the right shows the gap between what you can earn on a 6-month CD and the blue line needed to just keep pace with inflation.
We prudently harvest income for our clients on a systematic basis from their balanced (stock/bond) portfolios avoiding the reliance on just bonds or CDs for current income. If investments are managed for growth during one’s accumulation years, you will be in a better position to draw income for life from those investments without having to count on higher yields.
We look forward to continuing to share the upcoming “interesting times” with you.