
Global Stock markets have extended the bull market run nine months into 2017. Bonds and real estate funds produced only modest returns. As we pen this letter every three months, we try to write to the issues we think are most on our clients’ minds. A common concern we hear is that the markets seems high, the bull market has had a very long run, there is lots of uncertainty in the world (political and otherwise) and, well, “when is this going to end?” The question of the hour is, “are we at a top?”.
These concerns are grounded and we’d like to address them. The current bull market is not the longest or most productive we have seen in the modern era though it is nevertheless impressive. Whereas the average bull market has lasted just over four years, the current bull market is over nine years old. On average, bull markets have gained 150% but this one has added 250% off the 2009 bottom 1. There is always some amount of uncertainty in the world and we contend this is already factored into current prices. We all know about North Korea.
We continue to advocate that controlling for risk should preclude chasing returns. The most direct way to do this is to periodically review the most basic of asset allocation issue, the stock – bond mix. As you can see throughout this report, the returns and behaviors of stocks and bonds remain quite different, making bonds a still effective method for dampening volatility.
A more interesting question to ask of this long running bull market might be simply “Why?” Some argue that low interest rates and quantitative easing by the Fed has created lots of liquidity that wouldn’t otherwise be there, leading to asset price inflation. Perhaps there is some merit there, but we would prefer to be more quantitative in our approach.
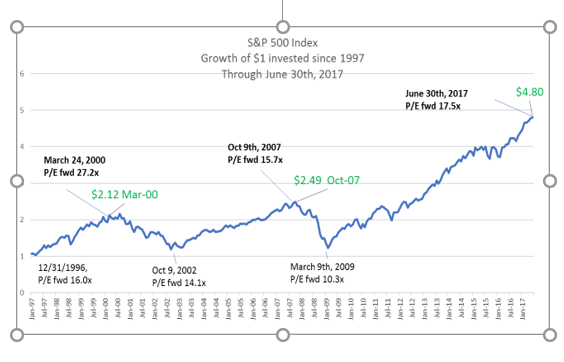
| Characteristic | Mar-00 | Oct-07 | Sep-17 |
| Index Level | 1,527 | 1,565 | 2,519 |
| P/E Ratio (fwd.) | 27.2x | 15.7x | 17.7x |
| Dividend Yield | 1.1% | 1.8% | 2.1% |
| 10 Yr. Treasury | 6.2% | 4.7% | 2.3% |
The table above and the charts below page help to weave a story in context with previous times (2000 and 2007) when markets had been doing well but were headed for a fall. We would point out that the alternatives to stocks 2 are not, in comparison, very appealing. Unlike at previous tops when the yield from 10 Year Treasury bonds greatly exceed the dividend yield of the S&P 500, those two are almost the same currently. Alternatives to stocks aren’t offering very enticing rewards, be it from low yields on bonds and money markets, or the trendless volatility of precious metals and other commodities (how much oil will the electric cars of future decades need?).
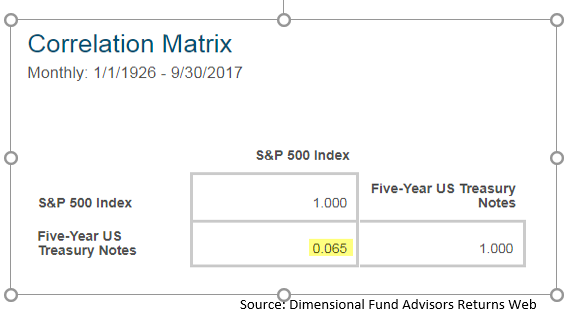
Context is always important. The bull market that continues into 2017 comes on the heels of a devastating fall (The Great Financial Crisis of 2007-2009) that shook the confidence of a generation of investors. Stocks remain relatively volatile but productive over time, and continue to “pair” nicely with a side of bonds. This is because the correlation between stocks and bonds is very low. Over time, the movements of stocks and bonds are nearly unrelated, hence a nearly zero (0.065) correlation figure over the last 91 years. Bonds continue to be as useful as ever at diluting the volatility of stocks allowing us to find the right mix to stay invested over the long haul.
1 Source JP Morgan Guide to the Markets, Dimensional Funds Returns Program
2 Here we are using the S&P 500 as a proxy for stocks, but they represent the US Stock market. Conditions in non-US Markets are different, but many of the same conditions apply.
Past performance is no guarantee of future results. Diversification does not protect against loss in declining markets. There is no guarantee strategies will be successful. Investing involves risk, including loss of principal.