
Happy New Year! We enter 2018 after an exceptional year in the global stock markets. The U.S. market delivered a whopping 21% while global developed and emerging markets outdid that, delivering 24% and 37% respectively.1
It’s common to experience that good news with mixed emotion. On the one hand, you celebrate a generous year in portfolio returns. On the other hand, you might be wondering if markets are now getting overpriced and whether you should be cutting back your stock allocation or even getting out altogether.
The emerging field of behavioral finance gives us lots of insight into why we might be asking ourselves if it would be prudent to scale back on stocks. The driving force is our fear of future regret.
Imagine that you considered scaling back, chose not to, and then experienced a significant reversal in stock prices. You would feel regret, kicking yourself for not having acted. Our fear of experiencing this regret can be a powerful motivator to act now. In fact, our experience of pain from a loss has been demonstrated to be about 2.5 times as powerful as our pleasure from the same gain.
But regret cuts two ways. Had we acted out of fear or uncertainty in the recent past (say after the last presidential election) and moved to cash, the last year would have been a painful one to watch from the sidelines. On top of the regret of having missed a significant run up is the ADDED uncertainty of when to reinvest.
Enduring volatility is part of capturing the returns of the stock markets over time. Using low cost, index-type funds as we do, we get virtually all of the market returns without having to outguess short-term market psychology. Rebalancing from time to time, such as when cash distributions are paid, helps to keep the risk/reward ratios in line.
Are we in a stock market bubble? Despite high prices, we don’t think so. Markets are indeed higher than a year ago, but so are corporate earnings. A common measure of stock market valuations is the Price-to-Earnings (or P/E) ratio. It’s the price of a stock (or stock market index) divided by the earnings from that stock or index. Let’s look at the S&P 5002 for example. As of January 12th, the S&P 500 closed at $2,787. According to Factset, the expected aggregate earnings over the next 12 months is $150 per share3. We calculate a forward P/E for the S&P 500 with simple math: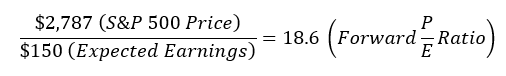
10 Year Treasury Bonds are safer in terms of lower volatility than stocks, but their low yield (2.55% as of this writing) has an “equivalent” P/E ratio of about 39: 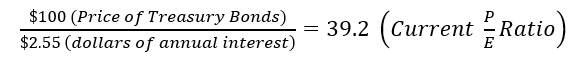 The lower the P/E, the cheaper the asset. This is not an “apples to apples” comparison since investors must be enticed by a lower price for stocks to compensate them for the extra uncertainty. But looking at the P/E ratios does help explain the demand for stocks in a low interest rate environment. Never short for clever acronyms, Wall Street has named this TINA (There Is No Alternative).
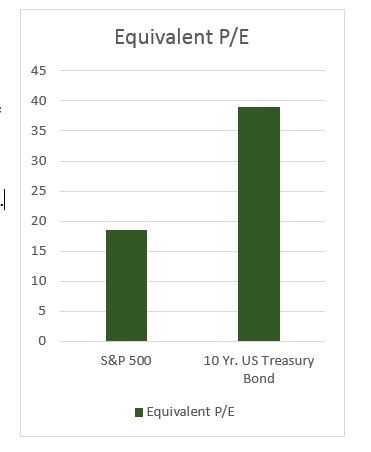
While we feel comfortable with stock market valuations, we think it very reasonable to expect increased volatility and potentially more modest returns in the year ahead. That’s simply because volatility has been much lower than usual and returns have been higher than average. We remain committed to our long-term stock allocations to continue to benefit from the growth they are poised to deliver. And we maintain our bond allocations for the defensive role they play in the portfolio, giving us something to work with to “buy the dips” in the course of normal rebalancing.
As we enter 2018, we welcome Colin Drake, CFP®, RLP® to the team as a partner. We’re very much looking forward to the chance for you to meet Colin and have him join us in taking great care of you. We’ll be reaching out to set a time for a call or meeting to get acquainted.
In the meantime, we wish you a happy and healthy beginning to the new year and look forward optimistically to a great 2018 together!
David N. Shore, ChFC Colin Drake, CFP®, RLP®