
The first quarter of 2019 delivered exceptionally high investment returns. Global stocks saw double digit growth.
• US Stocks and Global Real Estate were both up over 14%
• Developed International Stocks were up 10.5%
• Emerging Markets Stocks were up 10%
• US and Global Bonds were up 3%
This did wonders for rebuilding portfolio values after the tough end to 2018.
How Long Can This Bull Run?
The market drop at the end of 2018 was just shy of the 20% decline typically used to qualify as the end of a bull market and the beginning of a bear market. As of 3/31/2019 we are now 121 months into a bull market.
We are hearing more investors express the sentiment these days that the bull must be nearing its end. While we can’t say when it will turn around, there is historical context helpful to illustrate that we are not in an unusually long bull market. The length of our current bull is just above average so far.
The chart below shows every bull and bear market in the S&P 500 index since 1926. The blue areas illustrate the length and total return of bull market periods while the red areas show the length and decline of bear markets.
It’s worth noting the previous bull markets that have exceeded the length of our current bull. It’s also worth noting that the total returns from those longer bull markets exceed that of our current bull.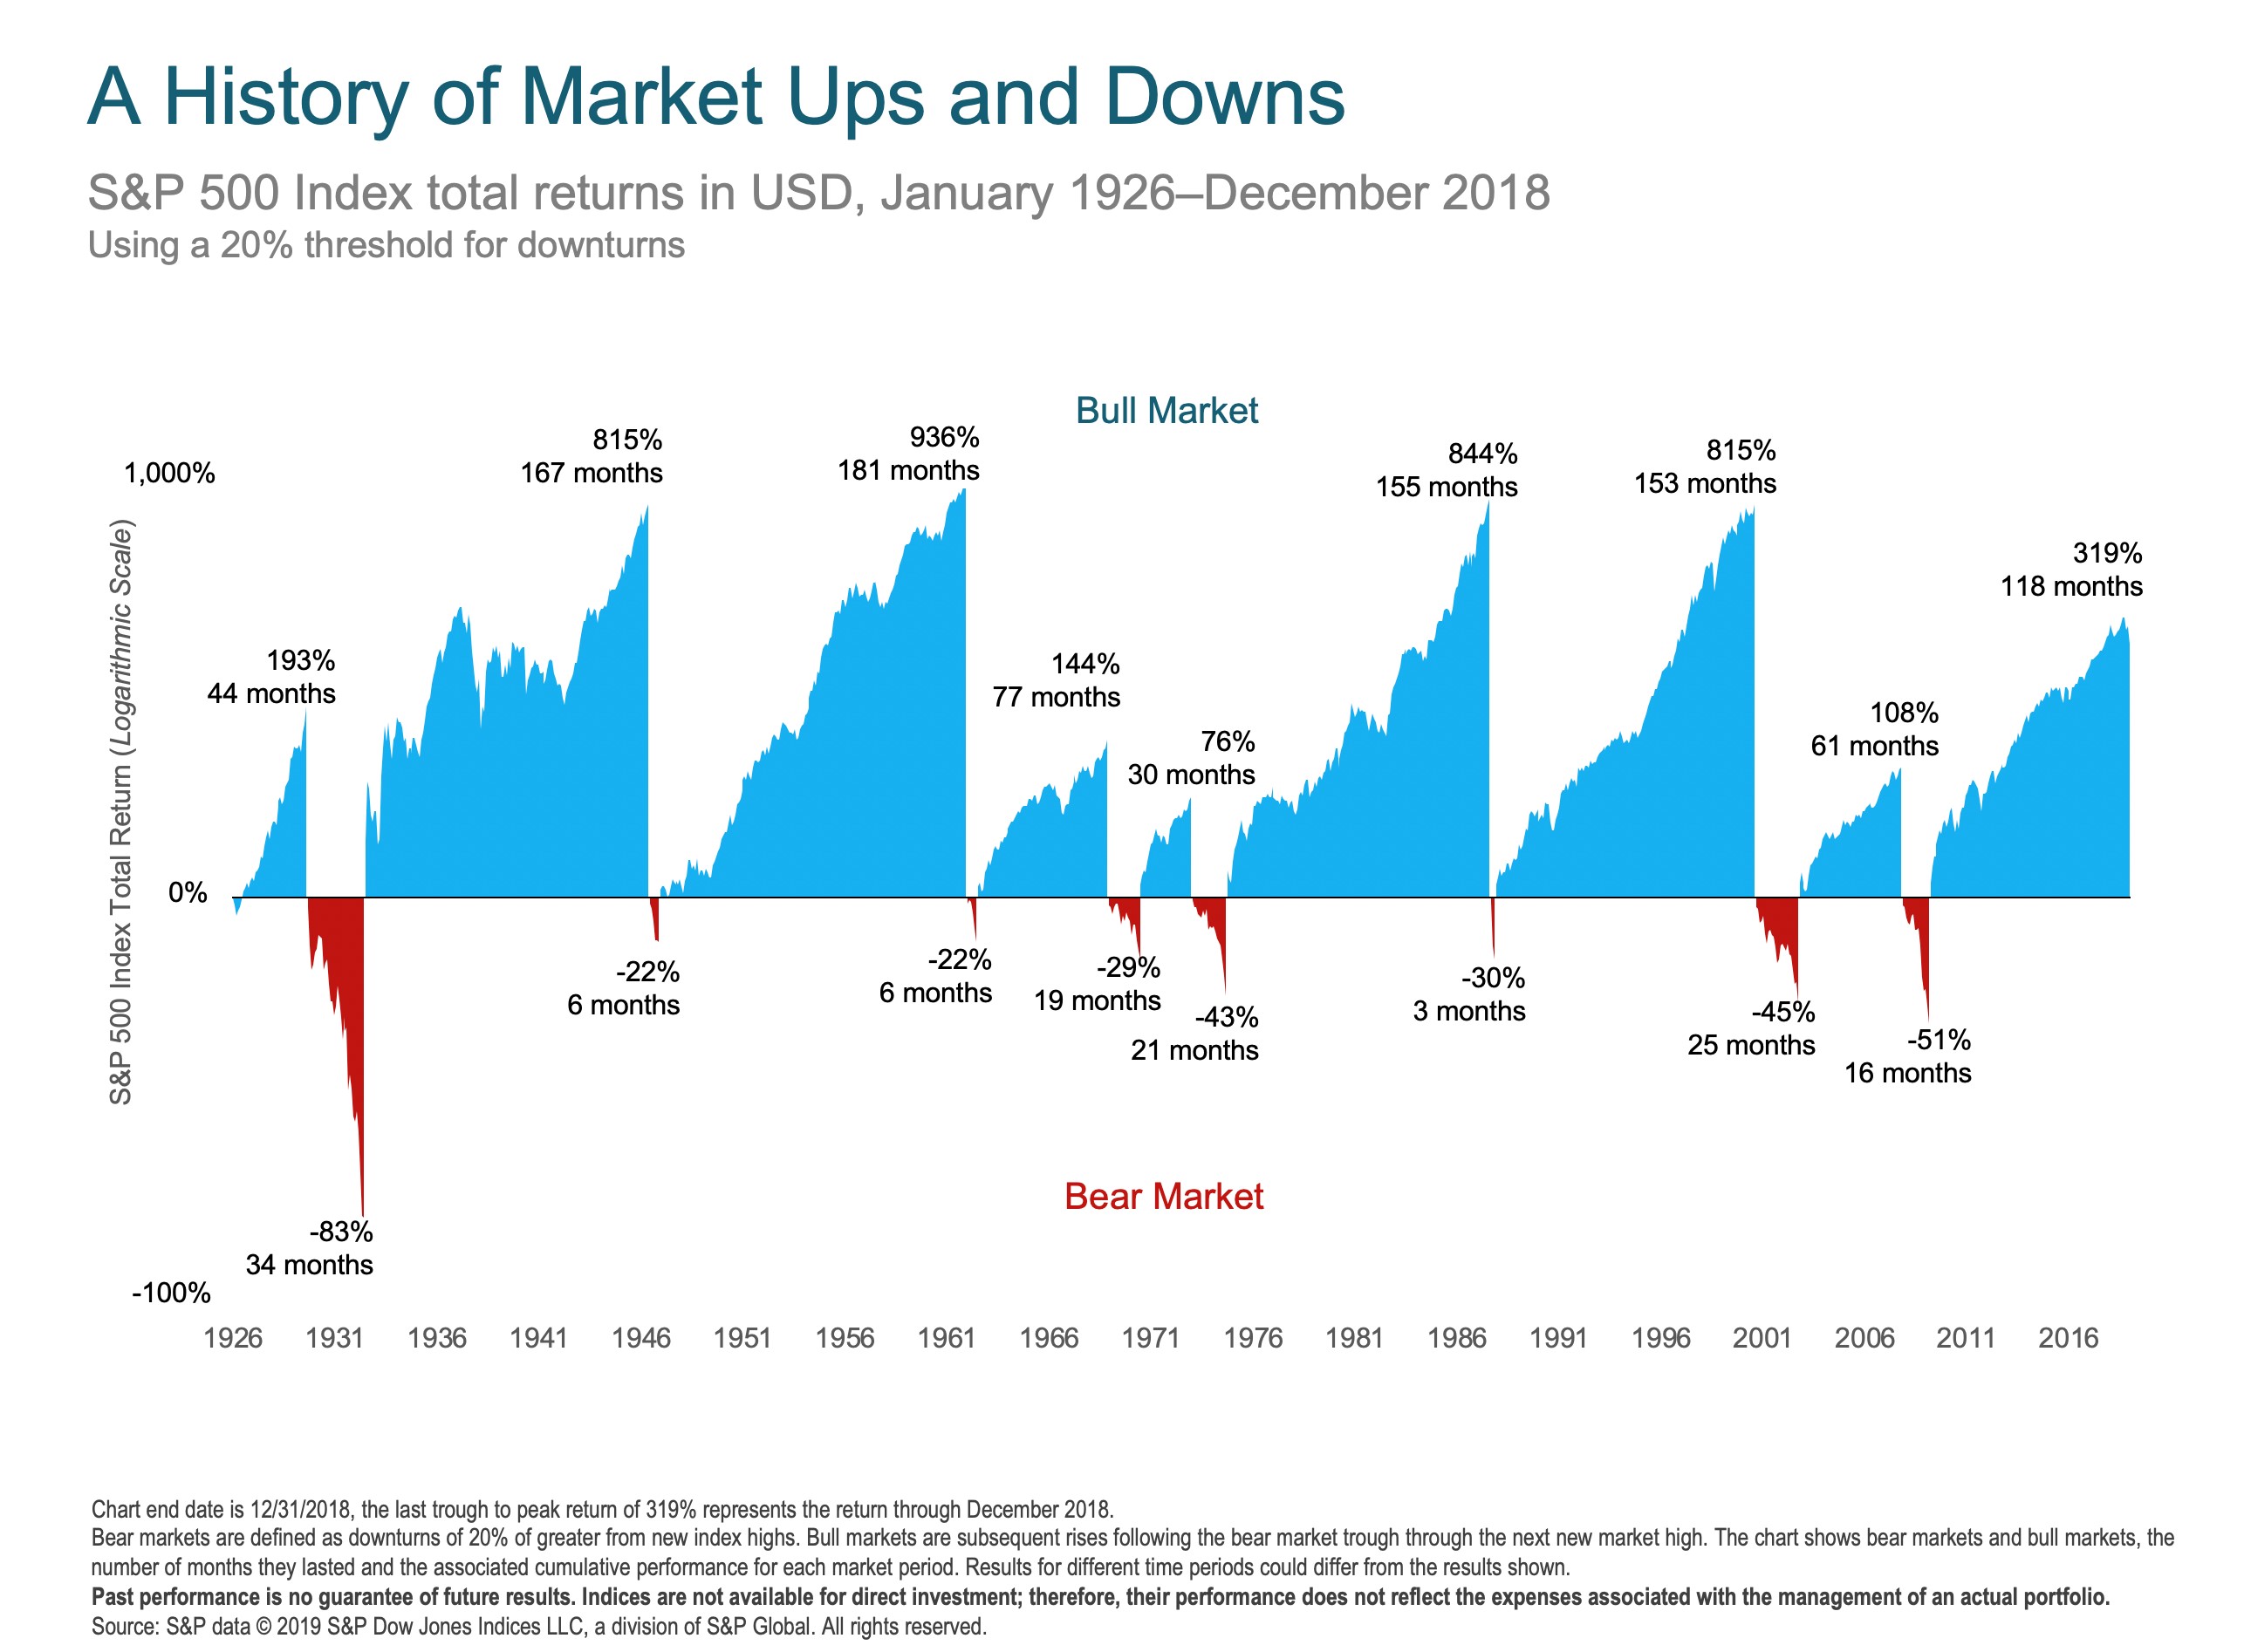
Another very important lesson to draw from the chart is that, while bear markets come, bull markets give back any ground lost and much, much more. The price of being an investor is being willing to sit through the “red” bear market periods to then enjoy the extremely healthy returns delivered by the subsequent “blue” bull markets.
How good are typical investors at remaining invested?
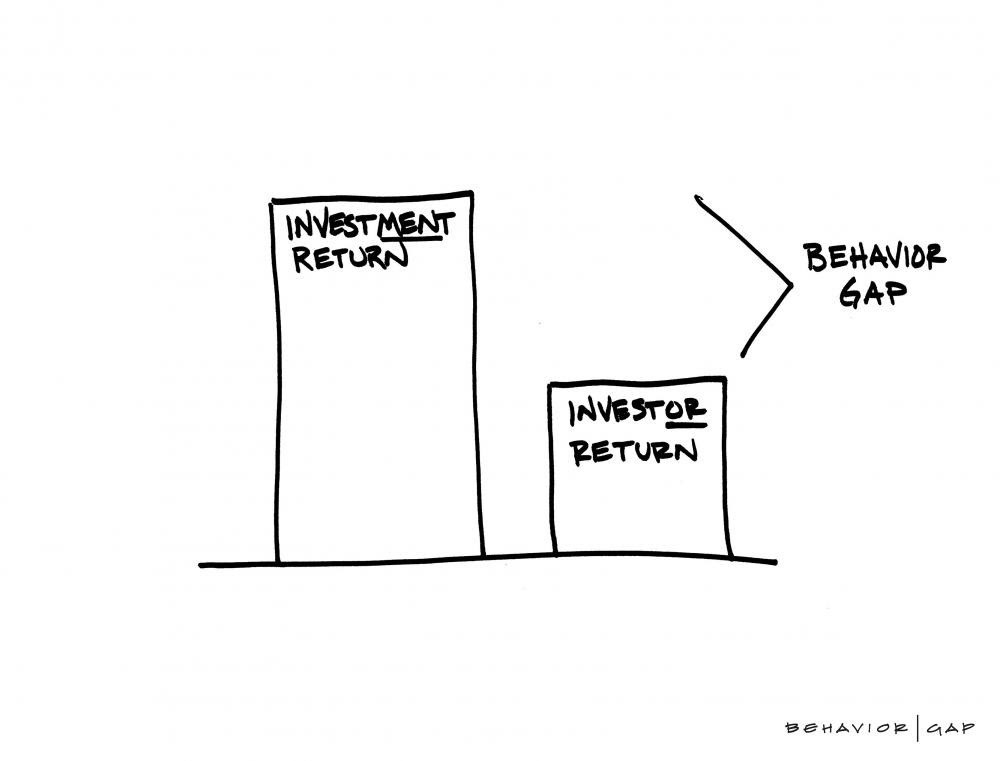
Pretty bad. Dalbar is a research company that publishes an annual report that compares the return the stock market delivers with the return actual investors in that stock market earn. 2018 was a fairly typical year in which investors who could have matched the market’s return by remaining fully invested actually did much worse. The S&P 500 was down 4.38% last year. The typical investor was down 9.42%.1
That extra 5% loss is what we call the “Behavior Gap” – the penalty inexperienced investors pay for letting their emotions drive their investing.
This Dalbar report typically sees investors lagging in both up and down markets. For example, in 2018, October was a down month: The S&P 500 lost -6.8% but the typical investor lost -8%. August was an up month: The S&P 500 was up 3.3% while the average investor was up just 1.8%.
Year after year, this report finds that investors are usually their own worst enemy and fail to exercise the necessary discipline to capture the returns markets deliver. As you know, we exercise that discipline because of our conviction that it will improve your longer-term returns. 2018 was no exception as we held steady through the turbulent year-end and were fully positioned to capture the fantastic returns that the first quarter of 2019 delivered.