
2021 delivered another solid year of global stock market returns. On the heels of a surprisingly excellent 2020 and a terrific 2019 before that, it is natural to feel apprehensive and question if this rising market can persist.
Human nature typically wants to apply the laws of physics to equity markets with a “What goes up must come down” mentality. Although this is true for physical objects, it’s not true for stock markets. Equities don’t play by the laws of physics but rather by the laws of finance.
What exactly do these laws of finance suggest?
Stocks always have a positive expected return. It makes no sense to invest in a security if you expect it to lose money. Although losing value is a possibility, everyone purchasing a stock has the expectation of a future reward from owning it.
Stocks are fundamentally valued by estimating the profits they are expected to earn over the years ahead and then determining a discounted price for those profits. The discount that is applied is the expected rate of return on the stock. The greater the stock’s perceived risk, the greater the discount/reward expected.2 Stocks would not be purchased as an investment if there was no positive expected return.
Every day, millions of investors, analysts, traders and computers assess the return prospects of virtually every stock on the globe by incorporating all known information about the company and calculating a fair price for the stock. There may be widely varying calculations about what a fair price is, but the stock eventually trades at the price where willing sellers agree with willing buyers. This is known as an efficient market.
What makes stock prices fluctuate?
First is that new information about the company, the economy and the world is quickly digested to calculate a new stock price. If profits are now projected to be higher or lower than expected, the fair price changes to reflect that. For example, the price for Carnival Cruise Lines stock adjusted downward once it became apparent that Covid would shut down cruise travel for some period of time and adversely affect earnings.
Second is human emotions and the balancing act between fear and greed amidst uncertainty. Despite periods of emotionally-driven irrationally high or low prices, markets consistently do a fantastic job of eventually reflecting fair prices for securities and delivering appropriate returns for taking the equity risk that each presents.
It’s reasonable to question if, after 3 such good years and markets at or near their all-time peaks, we can still expect solid future returns.
The chart below illustrates in darker blue the average annual S&P 500 Index return that was experienced 1, 3 and 5 years after hitting a record high over nearly a century of data. The lighter blue columns illustrate the 1-, 3- and 5-year average annual returns experienced after any other starting point. They are amazingly similar. 1
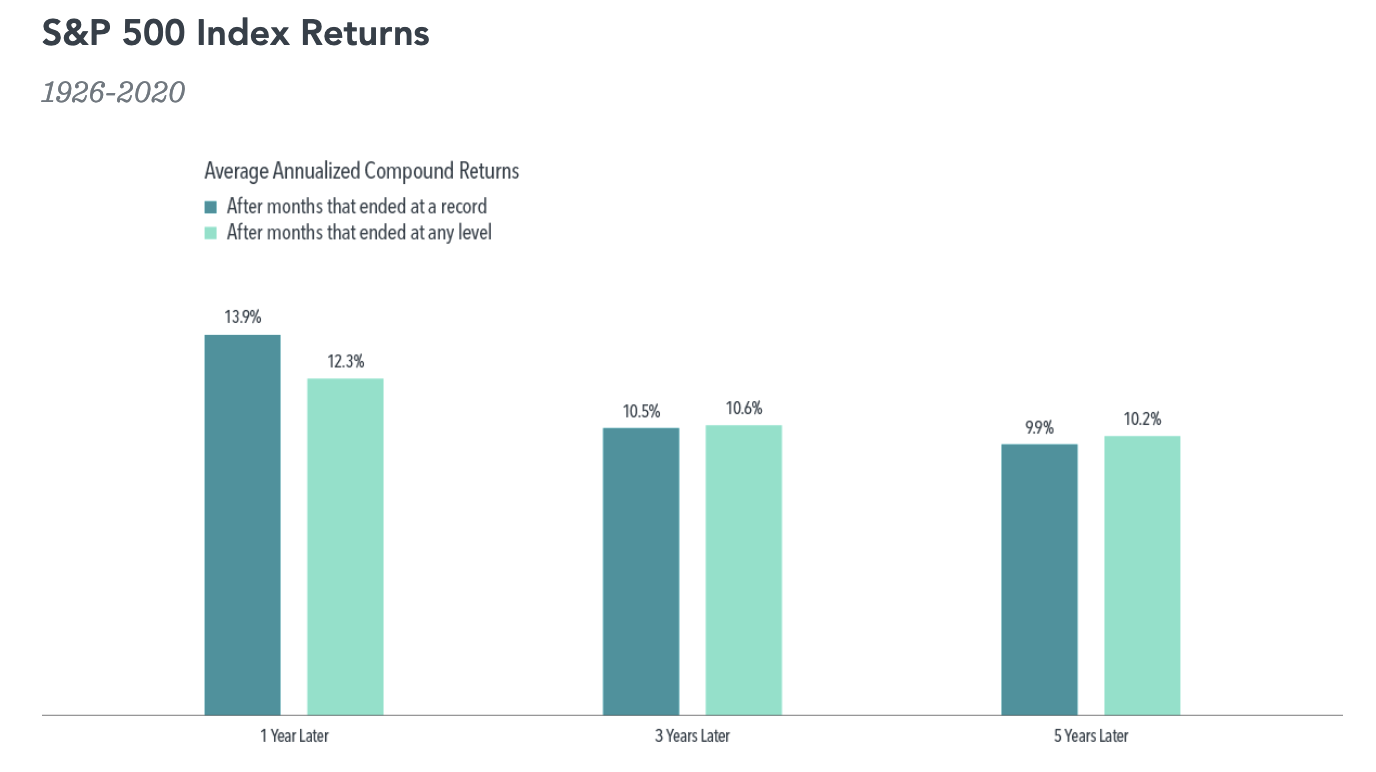
The data shows that future market returns after all-time highs are right in line with returns experienced after any other time.
The S&P 500 hit 70 all-time highs last year. That makes sense – since markets go up much more than down over the years, they are constantly setting new highs.
All that being said, we will absolutely see market drops, also known as pullbacks. They are normal, expected, unpredictable and inevitable. These corrections are simply new information and new emotions being reflected in the calculation of fair market prices.
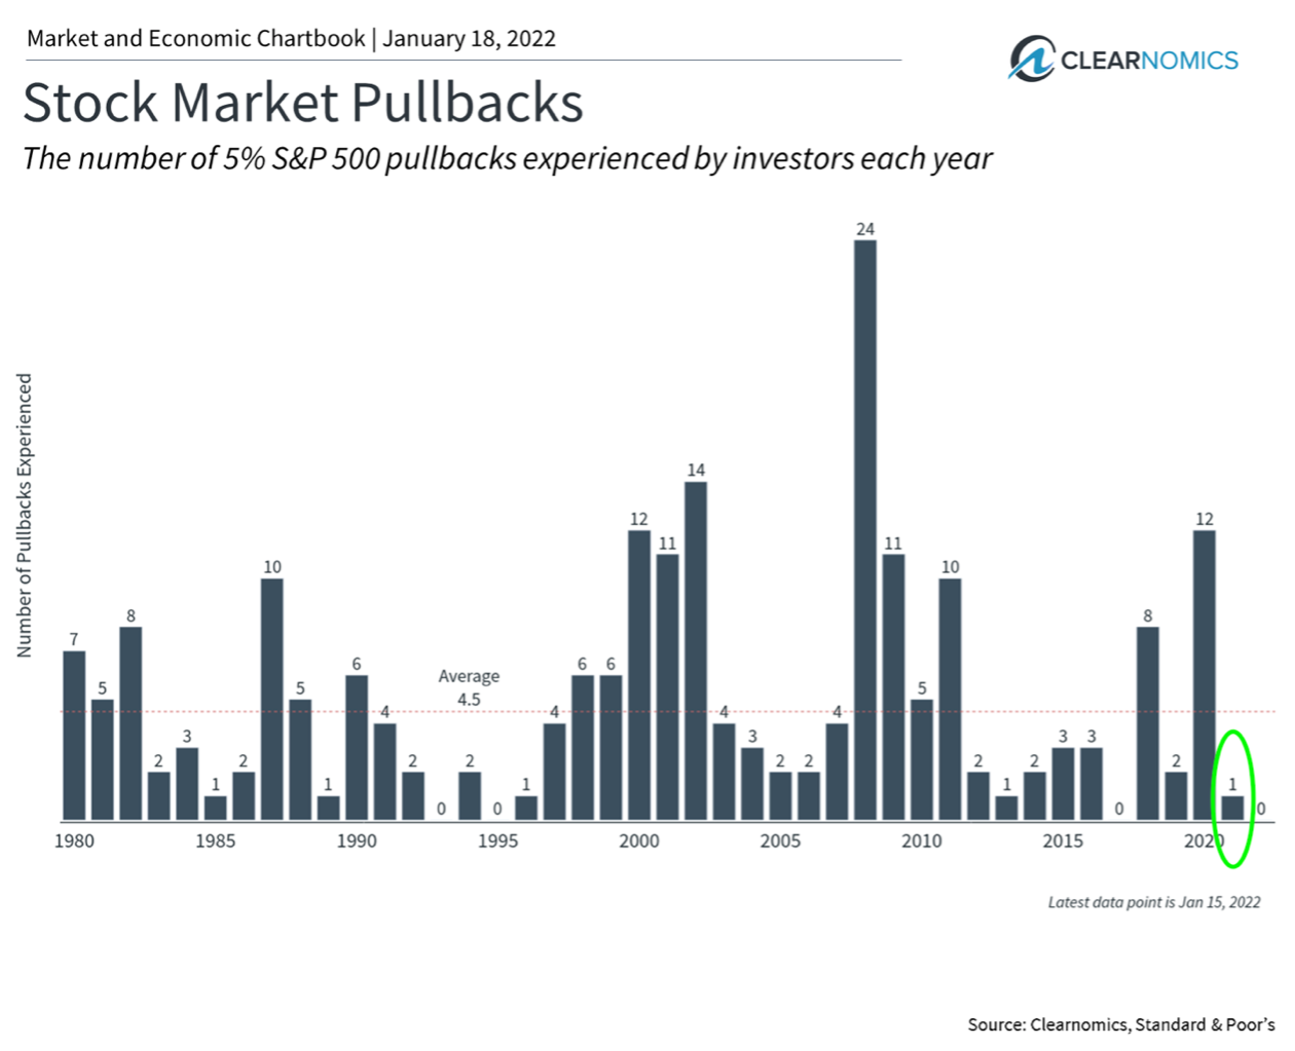
Last year we saw many fewer drops than normal. The chart below shows the number of drops of 5% or more in the years listed. In 2020 the market dropped 5% or more 12 times, whereas 2021 (circled in green) only had one such occasion. Given that such drops happen about 5 times per year on average, it would be reasonable to expect more frequent market pullbacks in the year ahead.
As usual, the MFA plan is to maintain our disciplined diversified strategy and ride patiently through the drops to benefit from the recoveries and new highs when they arrive. And, these pullbacks can offer us the opportunity to rebalance portfolios, shaving off from what has done well (selling high) and adding to what has pulled back (buying low).
We hope, despite the continuing restrictions the pandemic turning endemic causes, that you are in high spirits and looking forward to an excellent 2022.
1 Past performance is no guarantee of future results. Performance may increase or decrease as a result of currency fluctuations. In US dollars. For illustrative purposes only. New market highs are defined as months ending with the market above all previous levels for the sample period. Annualized compound returns are computed for the relevant time periods subsequent to new market highs and averaged across all new market highs observations. There were 1,139 observation months in the sample. January 1926–December 1989: S&P 500 Index, Stocks, Bonds, Bills and Inflation Yearbook™, Ibbotson Associates, Chicago. January 1990–Present: S&P 500 Index (Total Return), S&P data © 2021 S&P Dow Jones Indices LLC, a division of S&P Global. All rights reserved. Indices are not available for direct investment. Their performance does not reflect the expenses associated with the management of an actual portfolio.
2 To illustrate simply, what would be a fair price to pay someone for a dollar bill that is absolutely guaranteed to be given to you immediately? With that certainty and immediacy, a fair price for that dollar would be a dollar. Now imagine someone is “most likely” going to pay you about a dollar a year from now. What would you pay for that possibility? With that uncertainty, you likely wouldn’t be willing to pay $1 for it. You would need to discount that expected future dollar to be rewarded for taking the risk that you might not get what you expect when you expect it. Perhaps you would pay $0.80? And if you get your dollar, the 20-cent profit (which was the discount you required) is your reward for taking the risk.