
Recent performance across asset classes has led some clients to wonder out loud if we should have less money allocated to bond and emerging market stock funds. This is an understandable reaction to a 5 year period when pegging all of your investment dollars to the US stock market has provided the best return.
Performance of Select Indexes over Time
| Index |
2008 |
1 Year |
3 Years |
5 Years |
10 Years |
20 Years |
| S&P 500 |
-37.0% |
17.3% |
19.8% |
16.7% |
8.2% |
9.6% |
| MSCI Europe, Australasia and Far East |
-43.4% |
-0.6% |
9.7% |
6.5% |
5.8% |
4.9% |
| MSCI Emerging Markets |
-53.3% |
0.6% |
3.2% |
4.6% |
10.5% |
N/A4 |
| Barclays US Government/Credit Bond |
5.7% |
4.1% |
2.8% |
4.4% |
4.6% |
6.2% |
Source: Dimensional Fund Advisors Returns Program – Period: November 2004 – October 2014
While the sentiment is valid, the evidence across longer time periods still argues in favor of diversification.
“Should we be invested in bonds in this low interest rate environment?” is a common question. We are not aware of another asset class that provides the steady income and low correlation to stock returns over time.
Consider the significant stock market decline in 2008. Although most of us would like to forget it, the S&P 500 (a proxy for the broad US stock market) declined by 37% in 2008. Mathematics tells us that it takes a 59% gain 1 just to break even following such a decline. A hypothetical investor who (for simplicity’s sake) held half of her portfolio in the S&P 500 Index and half in the Barclays 1-5 Year Government/Credit Bond Index 2 (50% stocks/50% bonds) would have lost 16% during 2008 but more importantly would have required just a 19% gain 3 to recover. Bonds tend to temper losses when stock markets swoon so we continue to hold them in the safe “Income” portion of our portfolios.
Randomness of Returns 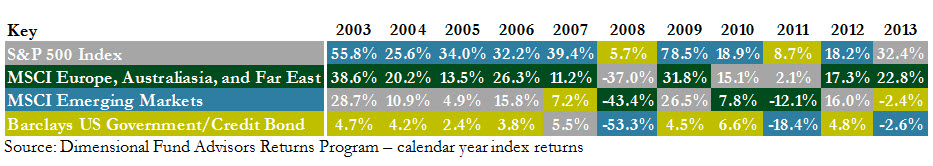
Others ask why we invest in emerging market stocks when they are clearly lagging behind US stocks. As evidenced by the recent differences in performance, holding international stocks provides diversification in returns which can provide shallower dips. Clients who have been working with us for 10 years or longer can see on their quarterly review reports that emerging markets funds outperformed US stock funds over the last decade despite the underperformance over the last five years.
The performance table above demonstrates that emerging market stocks have exceeded US stock market returns by more than 2% per year for the last 10 years. The second, colorful chart illustrates the unpredictability of returns from year to year. No long term patterns prevail. Notice that emerging market performance (blue blocks) is more volatile and tends to be either the best or worst performer when compared to other asset classes in which in we invest. The reward for the higher volatility of emerging market stocks is the higher long term expected (and actual) returns.
As you know, we can’t predict when trends will appear or disappear so we don’t try. Instead we rely on evidence-based research from leading academics to inform our asset allocation decisions.
Feel free to contact us to discuss further on this or other topics.
Footnotes:
1 [100 – 37%=63, then 63 x 59% = 37, so 63 + 37 = 100]
2 An investor cannot invest directly in indexes – for illustration purposes only.
3 [100 – 16%=84, then 84 x 19% = 16, so 84 + 16 = 100]
4 Emerging Market data not available before 1987.
MFA used the returns program from Dimensional Fund Advisors (DFA) to calculate returns.