
Bestselling author Michael Lewis has another hit on the shelves, “The Undoing Project” in which he profiles the fascinating collaboration of two Israeli born psychologists Daniel Kahneman and Amos Tversky whose research, writing and teaching challenges the way we think. It points out the flaws of our mental wiring that were largely soldered into place thousands of years ago and haven’t caught up with modern realities.
Mr. Lewis’s compelling read had us going back to one of our favorites, Daniel Kahneman’s 2011 book, “Thinking, Fast and Slow”. Dr. Kahneman, a psychologist, was awarded a Nobel Prize in Economics in 2002 for the work he did in the field now widely known as Behavioral Economics. We used his thinking to take a look at the surprising gains of the stock market since the recent election.
One of the early formative stories in Dr. Kahneman’s research was his experience as a 21-year-old psychology graduate. He was tapped by the Israeli military to assess not only their training techniques, but also to design a system or test that would identify in advance those who would be superior soldiers, tank commanders or fighter pilots. He observed flight instructors conducting their training exercises. Knowing what he did about positive reinforcement being more effective than criticism, he suggested that the commanders were being too harsh.
“That may work in your Ivory Tower world of academics” sneered one wizened old warrior, “but out here in the real world of combat with men’s lives and planes on the line, I’ve noticed that every time I chew someone out for flying badly, he does better the next time. And when I praise a pilot, he inevitably does poorly the next time out. 1
In a flash of insight, Danny Kahneman realized the flight commander was making one of the most fundamental mental errors, missing the basic math of reversion to the mean. What made this fresh faced psychologist really special was that he knew it wasn’t enough to recognize and explain the error of thinking, he had to lead the flight instructor to seeing it for himself, so he designed an exercise.
As brilliant as it was simple, he asked every  officer in the room to turn his back to a target on the floor. Each officer was asked to toss two coins in immediate succession at the target behind them and the results of each toss were recorded on a board. All those who had done relatively well on their first toss did relatively poorly on their second toss. What they were seeing with their own coin tosses was the same randomness of skill they had seen in their pilots, with results doing a normal variation around the average performance.
So, what does this have to do with the stock market since Trump became President? Among other things, we are seeing a reversion to the mean. 2016 was the worst January in the 120 history2 of the Dow Jones Industrial Average. Likewise, the S&P 500 had a rough start with one of its six worst Januarys in 91 years!
From 1926 through the end of 2016, the S&P 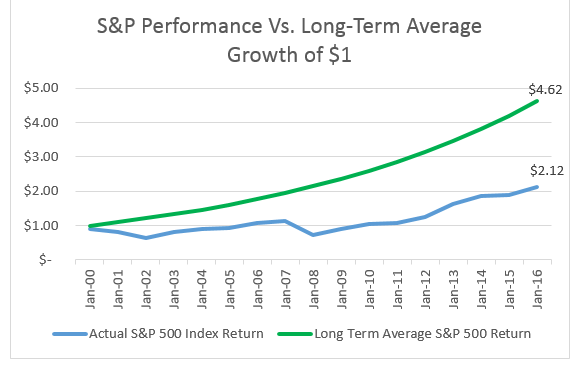
500 has averaged a compounded annual rate of return of 10.04%2. Since January 1, 2000, that average has only been about 4.5% per year, less than half its long-term annualized rate. Notably, the Dot.com Crash began the 2000’s and the Great Financial Crisis marked its middle. It’s not rare to have dramatic rises and
falls in the stock market, but it has been uncommon to have such distinctive
reversals so close in time to one another.
As a result of that timing, the seventeen year returns of the US Stock
market (2000 – 2016) have disappointed many investors. Note the chart to the right – had the S&P delivered its average long-term return since 2000, the investment results would have been dramatically better.2
But we should do the same “coin toss” test with this observation that Danny Kahneman gave to the pilots and their instructors. Fortunately, have a fairly long history of observing the S&P 500. If we add up all the 17 year periods since 1926, we can compare them. The first 17-year period ended in 1942 and there have been 75 of these rolling year intervals since then. 41 of those periods have compounded returns above the average, with the highest being 18.2% ending in 1998. 34 of those periods were below average with the worst being a barely positive 3.51% percent per year ending in December of 1945 (the end of WW II).
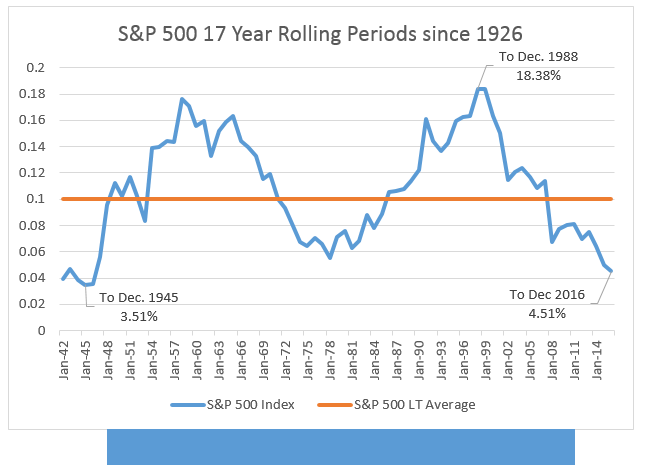 As we often point out in our narratives and articles, the compelling mathematics of ‘reversion to the mean’ dictate that good times will follow bad and bad times will follow good. The chart to the right shows that our recent 17 year returns (the equivalent of the pilot coin tosses) were quite poor and a long way below average. The optimists among you might see the recent strong returns as the beginning of a reversal. The more hardened skeptics might think “we’ve seen this before”. We cannot predict the exact shape of the trend as it plays out, but we can notice that the 4.51% 17 year annualized return ending December 2016 was among the lowest since 1926.
Should the blue line continue to rise and improve the average in the coming months and years, it may be that political or business leaders will try to claim credit for the miraculous turnaround. As fans of empirical facts, we will see it as simply a reversion to the mean.
David N. Shore, ChFC Timothy C. Harrington, CFP®
1 Paraphrased from Chapter 17, Regression To The Mean, “Thinking, Fast and Slow”, Daniel Kahneman, 2011.
2 Sources Fama French CRSP 1-10 Data Base and Dimensional Funds Returns Program