
The persistence of Greece’s financial woes and speculation about the potential exit of Greece (aka Grexit) from the European common market feels a bit like Ground Hog Day, in which Bill Murray lives the same day over and over throughout the movie until he executes that one day perfectly, start to finish. There is no assurance of such a perfect ending for Greece – the opposite seems more likely – but the news stories concerning Hellenic finances in 2015 are remarkably  similar to those of 2012.
Greece’s economy is roughly the same size as Oregon’s. This is no slight to California’s neighbor to the north, but if we were worried about Oregon’s economy shrinking by 25% or defaulting on some government debt, we would hardly expect that fact alone to roil world markets.
An important rule of science is that correlation is not causation. As factual as that statement is, it will not stop anyone with a cause from claiming credit for the turn, when the turn comes. Whether the recent market choppiness is due to Chinese Stock Market volatility (up 86% in 12 months, then down 20% in the last month1), the Grexit, income disparity or global warming, if this turns out to be the first significant setback in one of the longest US stock market bull market rallies,2 we may or may not ever really know the cause. Being armed with the facts of the past and not being able to explain the events of the present gives some insight as to how difficult it is to make a future forecast based on a guess about future data.
Globally diversified portfolios are essentially flat for the past quarter and year, yet still up substantially over the past five. US Markets have continued to outperform and have just begun to reach into the higher end of the mid ranges of historical valuations3, while International Developed and Emerging Markets are becoming cheap by comparison. Ironically, while Europe is portrayed as mired in their financial woes, the Non US Developed Markets lead the US so far this year by a wide margin.
So why do we cling to the healthy but bitter taste of a diversified portfolio (spinach and kale salad, anyone?) when we could be biting into the cheeseburger/fries/chocolate milkshake equivalent of the US Stock Market alone?
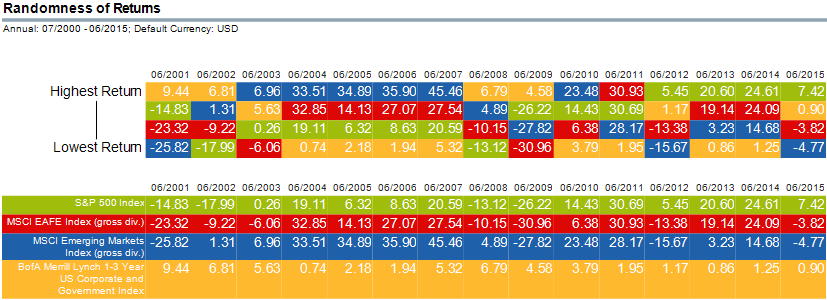
Anyone can “see” below that the US Market (as measured by the S&P 500) has been on a relative tear (Green Shading in table below) for the past four years4. It wasn’t that long ago that the economic miracle of the Developing World seemed to have similar unstoppable momentum (Blue shaded cells in the table below) up through June of 2007.
As always, we’d be happy to discuss your accounts or other matters with you at your convenience.
_____________________________________________________________________________________________________
1 First footnote – China up 100% to June of 2015, then down 30% in a month. Bloomberg article
2 Second Footnote – Current US Bull Market longest in duration (not magnitude) since 1903
3 Third Footnote – Current P/E vs Historic
4 Fourth Footnote – Source Dimensional Returns Program, MSCI[DS1]
[DS1]Consider using the Word Function for Footnotes in the References Tab
[DS1]Consider using the Word Function for Footnotes in the References Tab