What’s Been Happening?
In recent months, capital has seemed to be on strike. Bank failures, forced selling and changing government policy have sent a number of investors to the sidelines, waiting for better times. Through the meltdown, cash has been a refuge. We don’t expect this to persist given the velocity of government borrowing and printing of money. In the event of inflation, the real loss of value in a cash account is no different from a price drop in a stock portfolio. Holding cash also results in opportunities lost when the markets recover.
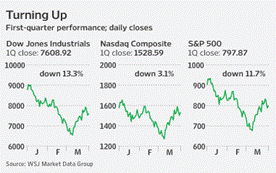
The S&P 500 index commenced a 21% rally over 13 trading days in March largely due to announcements of details and enhancement to government stimulus plans. The fact that comments by Citigroup’s chief executive stating that the firm had been profitable for January and February [two months!] helped feed the rally is a testament to the unusual times.
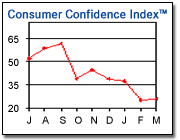
As you probably know, consumer confidence has plummeted this year. Given their large impact on the economy, consumers have to regain some confidence for a recovery to occur. While too early to tell if it’s a trend, the latest figures displayed in the chart below indicate at least some recent stability.
Trends to be Aware of
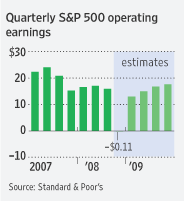
Corporate earnings estimates continue to be adjusted down. Just last October the consensus among Wall Street analysts was that earnings would rise 28% in the first quarter of 2009 compared to the already depressed first quarter of 2008. The current estimate for the S&P 500 represents a 22% decline from earnings a year ago. In the next few weeks, actual company reports will tell us if the current estimate was accurate. If earnings fall short of this level, we should expect stocks to weaken. However, unexpected news such as positive earnings comparisons, lower stockpiles of inventory, or improvement in the housing sector could continue to carry the market.
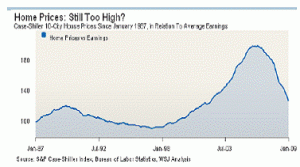
Housing prices are still falling significantly. The latest report from S&P Case-Shiller shows nationwide prices down 19% from a year ago. While sales activity is rising [mostly lower priced homes], price declines must at least decelerate before the news is good from housing. The Fed’s move to help lower
mortgage rates may help in the coming months. The chart above shows how housing prices are beginning to approach more sustainable levels when looked at relative to average household earnings [which is the most meaningful way to analyze prices]. Housing prices at 200% of household income was just not sustainable and formed a bubble.
Elsewhere in the world of bricks and mortar, commercial real estate is also under a great deal of pressure. Real Estate Investment Trusts [REITs] have been on roller coaster ride. After far outpacing the S&P 500 index for six years, REITs have given back much of that advantage over the last two years. The REITs we invest in are down from 55% to 60% in the last twelve months – in line with the sector. Banks have been refusing to roll over multi-million dollar mortgages on office buildings and shopping malls as appraised values continue to plummet and few sales provide comparables. At some point, we expect “value vultures” to swoop in with some of the cash that is sitting on the sidelines and this ugly trend will reverse itself.
While it may be difficult for many to see right now, opportunities are born out of severe dislocations in prices. Investors with money to put to work will likely be amply rewarded for investing when things looked darkest. Those of us who continue to hold our investments are positioned to be rewarded for our patience over time. Those who have cashed out will likely not feel comfortable investing until much of the rebound has occurred.
We continue to have a long term positive outlook for the markets but as we wrote months ago, until the credit markets break from their deep freeze, the economy can not recover. Therefore, we would not be surprised to see more dips in the market averages until the credit markets normalize.
Some Numbers for Comparison:
The following table compares some key indices against which fund performance is measured. All figures are for the periods ending 03/31/2009.
|
Index |
What it Measures |
Last 3 Mos. |
Last 12 Months |
3 Years Annlzd |
5 Years Annlzd |
10 Years Annlzd |
| Standard & Poors 500 | U S Stocks w/div |
-11.01% |
-38.09% |
-13.06% |
-4.77% |
-3.00% |
| Russell 2000 | Small Stocks |
-14.95% |
-37.50% |
-16.80% |
-5.24% |
1.93% |
| Morgan Stanley EAFE | Foreign Stocks |
-13.94% |
-46.51% |
-14.47% |
-2.18% |
-0.84% |
| MSCI Emerging Mkts | Emerging Mkts |
0.95% |
-47.07% |
-8.15% |
5.91% |
7.84% |
| DJ World Stock Index | Global Stocks |
-10.74% |
-42.61% |
-13.24% |
-2.58% |
-.073% |
| DJ Real Estate Tot Ret | Real Estate |
-30.09% |
-57.95% |
-26.12% |
-9.84% |
2.98% |
|
Barclays 1-5 yr Gov’t/Cr |
Bonds |
0.53% |
2.70% |
5.68% |
3.70% |
4.66% |
| CPI * | Inflation |
0.93% |
-0.63% |
2.03% |
2.52% |
2.55% |
Chart Data Source: Thomson Financial
* CPI information is not current for past month.


