What’s Been Happening?
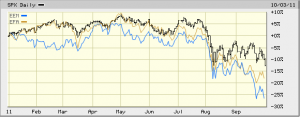
Stocks all over the globe fell precipitously starting in the middle of the third quarter. The small stocks and relatively cheap “value” stocks in the mutual funds we use suffered even more. Emerging markets stocks [blue line below] were under pressure as some investors appear to be selling their most risky assets in an effort to escape further losses. The tan line shows the developed markets outside of the U.S. being pulled down in the Spring by the aftereffects of the earthquake/tsunami in Japan and later by concern over how the European Union will contain the fallout from a potential default by the government of Greece on its bonds. At the end of the quarter, U.S. stocks [black line below] were down nearly 20% from their peak earlier this year.

Diversifying our stock exposure over these three asset classes continues to make sense to us as does our practice of allocating smaller amounts to the more risky emerging markets. While our emotional “action bias” might urge us to sell stocks after a +20% pullback, our more reasoned rebalancing discipline may call us to do the opposite. We know that buying low and selling higher is the goal.
|
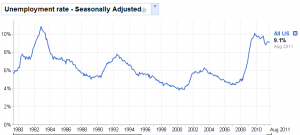
A client recently told us about a favorite maxim of Lee Raymond, former CEO of Exxon. While Raymond applied it to oil prices, we see its application to other global markets – especially stocks. “Easy glum, easy glow” Raymond observed that It is very easy to get depressed when prices are going down and to get overexcited when they are going up. Our client shared this with us because it reminded him of our disciplined long term approach to the markets and efforts to avoid excess emotions on either end. Unemployment remains high at 9.1%. Below is a chart that shows the jobless rate over the last thirty plus years. The 1981-2 recession resulted in a slightly higher rate but it was not as persistent as the current 2 year situation. Sentiment and consumer confidence are very low at these times of maximum unemployment but eventually, the economic cycle turns and more jobs are created. |
Other Trends To Be Aware Of
The chart below tracks how gold’s price has moved since the beginning of the year. It is down some 11% since hitting a record $1,889 in August. Precious metals don’t pay interest or dividends and can be very volatile to both the upside and downside. Gold seems to be losing its safe haven status as it has fallen in concert with the global stock markets much as it did during the second half of 2008 during the onset of the financial crisis. Gold is also thought of as a great buffer against inflation, but between 1980 and 2005 when consumer prices in the U.S. doubled, gold lost approximately 20% of its value. Finally, the price of gold is sensitive to interest rates. As interest rates rise, investors seek other investments yielding more than zero.
|
Double dip? The anemic recovery of the US economy is clearly slowing as demonstrated by the GDP chart below. It seems we are approaching an inflection point at which either the pervasive negative sentiment pulls us back into a recession or we bump along the bottom and slowly recover. The majority of economists surveyed still put the chances of a double dip recession at less than 50% but the number in the recession camp is growing.
Comparisons with Benchmarks – in the report that follows you will see that the return for each of the asset classes we invest in compared with a relevant benchmark.
|